11.21.2025
Sausage casings bulletin, November 21, 2025

...
The leather market is similar to many commodity markets as it is fundamentally driven by both supply and demand. While supply of leather is generated from hides and is relatively transparent, demand for leather is more opaque, as it is a function of consumer demand for products that contain leather which include shoes, furniture along with the automobile upholstery and accessories. In this article we will examine the drivers of leather demand and put forth an argument for the inputs that help define the Jacobsen Leather Demand Index.
According to a report conducted by the United Nations in 2010, leather use was dominated by the shoe market. Nearly 53% of leather that was used globally found its way into shoe production.
Furniture upholstery followed at 13.5%, along with clothing, leather goods, vehicle upholstery and gloves.
The Jacobsen Leather Demand Index (JLDI) will attempt to combine a number of inputs and assumptions in an effort to target changes in demand that occur on a global basis. Given the current trajectory of leather consumption, put forth by the UN report, the JLDI will extrapolate and will gauge shoes demand at 52%, upholstery at 14%, and automobile demand at 10%.
The JLDI will initially focus on leather demand as it pertain to shoes, furniture and vehicle upholstery, which incorporates approximately 76% of global leather demand. This means the model is approximately 68% shoes (=52/76), 18% furniture (=14/76) and 14% auto leather (=10/76).
The JLDI will incorporate the Jacobsen’s approach toward generating a robust leather demand model. Our focus as it relates to explaining leather shoe demand will concentrate both Chinese exports which account for 70% of the shoe exports globally, as well as the US retail sales of shoes.
The US is one of the largest consumers of leather upholstery. The JLDI will explain the volume of furniture and upholstery that is purchased in the United States and then combine these figures with retail sales changes that occur on a monthly basis.
The U.S. is the largest consumer of automotive vehicles. Using annual statistics, which reflect the number of cars produce globally with leather vehicle upholstery, the JLDI will incorporate a monthly statistic which combines monthly car sales figures using annual leather upholstery statistics. This will help approximate increasing or declining demand for automotive leather upholstery.
The JLDI will combine changes in the shoes, furniture and automobile market given assumption made about the makeup of these markets as leather is concerned, and generate an index that describes the monthly, year over year change in leather demand. Annually, the assumptions to the model will be revisited, and periodically the Jacobsen will make changes as more information become available.
Shoes
Shoes make up approximately 53% of the total leather consumed around the globe. The two largest importers of leather shoes include the United States and Europe. The US and the EU make up the two largest consumers of shoes. The top ten consumers make up approximately 70% of all shoes consumed globally.
In an effort to evaluate the demand for leather shoes, we constructed a model that combines leather shoes that are exported from China, which purchases on a retail level in the United States. China is considered the world’s largest exporter of leather shoes.
According to the American Apparel and Shoe Association, 98% of all shoes sold in the United States today are imported. The majority of shoes imported into the United States come from 5 countries according to the Worldfootwear.com.
As of 2013, China imports into the United States, 69% of total value (83% of total if we consider volume of imports). Vietnam (12%), Italy (5%), Indonesia (5%) and Mexico (2%) followed. Chinese export number to the rest of the world are similar. According to Worldfootwear.com, the Chinese export approximately 10 billion pairs of shoes, of which approximately 1 billion or 10% are leather (calculated from FAO leather exports from China). By monitoring monthly Chinese export figures, the demand for leather shoes can be observed from the increase or decrease in supply.
As far as aggregate shoes, the majority of the shoes that are sold in the United States are imported. According to the Food and Agricultural Organization and their study “World Statistical Compendium for raw hides and skins, leather and leather footwear 1993-2012 approximately 25% of shoes imported into the United States are leather. By using this static metrics the JLDI will look at the monthly percent change in shoes sales as reported by the Census Bureau. The time series is the Monthly Retail Trade and Food Services 4482: Shoe Stores: U.S. Total — Seasonally Adjusted Sales – Monthly Percent Change.
In evaluating the largest exporter of leather shoes, the JLDI will monitor the monthly export figures which are reported by the General Administration of Customs in China. Since footwear makes up 2.3% of Chinese exports according to the Worldstopexports.com, generating trade of $50,766,207,000, the JLDI will monitor the month over month changes in exports and multiple this figure by 2% and then again by 10% which is the approximate portion of shoes that are leather.
Leather Shoes Index Assumptions
By combining retail sales of shoes in the United States with exports of shoes from China, an index can be created that reflects the demand for shoes.
Furniture and Upholstery
The furniture market represents approximately 14% of the leather demand globally. According to the Furniture Today Upholstery Fabric and Style Survey approximately 32% of furniture is made from leather and suede’s. In an effort to track the demand for leather furniture the JLDI will track the month over month changes of furniture retail sales as represented by the Commerce Departments Advanced Retail Sales report.
By evaluating the year over year change in furniture and furnishings of retail sales on a monthly basis the index can capture the approximate change in leather sales. Increasing sales volumes translate into increasing demand. The index does not take into account the change in prices for furniture which could lead to higher or lower volume of furniture sold. Since leather and suede furniture accounts for approximately 32% of retail sales furniture sold, the JLDI will evaluate the retail sales report on furniture discounting the change by 32%.
Auto Vehicle Interiors
Leather demand in auto is approximately 10% of total leather consumed. According to Ward’s Auto, approximately 42% of cars and truck sold within the United States for the 2014 model year have factory installed leather. Aggregate leather installed increased from 35% to 39% from 2010 to 2011 and has remained stable over the past 4-years.
In an effort evaluate the demand for leather, the JLDI will follow monthly cars sales, and annually will adjust the aggregate percent of cars and trucks that are factory installed with leather.
JLDI Index
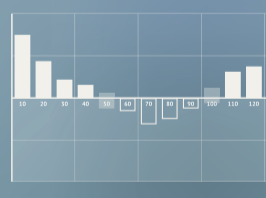
The Jacobsen derived its leather demand index by using an oscillator that captured an index from 1-100. The index is created from year over year changes to each of 4 time series. Car sales data using a multiplier which includes the percentage index of leather construction is weighted by approximately 14%. Year over year leather furniture sales is weighed by approximately 18%. Finally, Chinese exports of shoes and US sales of shoes that are leather are weighted by approximately 68%.
The JDLI readings are on the right axis accompanied by prices of Heavy Texas Steer on the left side.
11.21.2025
Sausage casings bulletin, November 21, 2025
11.14.2025
Sausage casings bulletin, November 14, 2025
11.07.2025
Sausage casings bulletin, November 7, 2025