11.21.2025
Sausage casings bulletin, November 21, 2025

...
The US hide market activity picked up a notch, but most sales are still pending. The balance of offerings overnight was steady-to-slightly higher and a fair number of hides and wet blue seem obtainable; however, producers still uphold they have respectable forward positions.
Today’s Market
There was a moderate number of sales reported today with prices from steady to firm and increases for HBH and HTS.
HNS 64 MIN @ $77.00 OR 0.9375
HTS 64/66 @ $73.75
HBH 52/54 @ $59.00 OR 0.8675
HBH 54/56 @ $55.50 OR 0.7875
HNS 64 MIN @ $73.00 OR 0.8900
HTS 64 MIN @ $69.00
BBS 62/64 @ $72.25 OR 0.8950
BBS 60 MIN @ $70.00 OR 0.9100
CBS 60 MIN @ $59.00 OR 0.7675
CBS 64 MIN @ $62.00 OR 0.7550
HBH 52 MIN @ $51.00 OR 0.7650
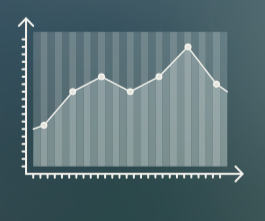
Price trends for the Jacobsen HTS and the US Bureau of Labor Statistics Producer Price Index (PPI) for Hides, Skin and Leather (primarily hides) from 1969 through 2016 are shown in the following chart. The chart also correlates these prices with recessions over the same period.
The negative impact on both price indices of recessions is an obvious observation from the chart which shows most of the major corrections in the hide market closely associated with a recession. Two exceptions were in 1997 (Korean Financial Crisis) and 2014 (drop in global commodities due to the China slowdown). For the US hide market, the last major adjustment was arguably the greatest which shows the influence China has on the US hide prices as it probably should with over 60% of its hides exported to that country.
On a final note, after questioning the exceptionally close association of the PPI (source the St. Louis FRED) with the Jacobsen HTS prices, a representative from the US bureau of Labor Statistics explained that the primary component for their data was hide prices leaving the packers.
Cattle Report Shows Expansion Continuing, but at Decreasing Rate
USDA National Agricultural Statistics Service (NASS) released its Cattle report January 31, 2017 which showed higher inventory numbers in many categories for the third consecutive year. The total cattle and calf inventory increased about 2% from 2016. Increases were seen in 27 States. States with the largest increases in all cattle and calves include Texas (+500,000 head), Missouri (+250,000 head), Oklahoma (+200,000 head), and Kansas and Colorado (+150,000 head each). The expansion was likely buoyed by a combination of strong cow-calf operator returns in 2014 and 2015 as well as improved pasture and range conditions in much of the Plains region. Beef cow numbers were 3% higher than the same period last year, but milk cow numbers were virtually unchanged Total beef cows increased 3%, but a number of indicators suggest that although the expansion continues, the rate of expansion is slowing. Heifers for beef and milk cow replacement are often used as barometers of herd expansion or contraction rates. Heifers for beef cow replacement were 1% higher than last year but down from the 4% and 3% increases achieved in 2015 and 2016, the first two years of this expansion.
Heifers for milk cow replacement show similar patterns, registering at 1% below 2016 levels, but were positive for the first two years of the expansion. Producers also indicated that they expect only 2% more beef heifers to calve during 2017, down from increases of 7% and 6% in 2015 and 2016.
Despite relatively cheap feed, returns to feeder cattle operations were negative, with losses widening during 2016. Despite expected improvements in cattle feeding returns, feeder cattle supplies outside feedlots are above last year and prices will remain under pressure through much of 2017. Feeder cattle prices for 2017 are forecast to average $131-139 per cwt, down about $7 from 2016.
The number of cattle on feed in U.S. feedlots with a capacity of 1,000-plus head on January 1, 2017, was fractionally higher (Cattle on Feed, January 27, 2017). Cattle placed on feed in December 2016 were up 18% compared with December 2015. This was the second consecutive month that there was a year-over-year double-digit increase in cattle placements. It is likely that lower numbers of cattle grazing on small grains pastures was a contributing factor to the relatively large increase in placements. Winter wheat planted area was lower than 2016 in most of the country, and the estimate of cattle grazing small grain pasture in Texas, Oklahoma, and Kansas on January 1, 2017, was 5% below 2016. Fed cattle marketings in December 2016 were 7% above that of 2015, but the increased numbers of cattle on feed on January 1 2017, and the timing of their placement suggest that fed cattle marketings in the first half of 2017 will be larger than 2016. With 2% more cattle outside feedlots on January 1, placements in 2017 are expected to be above 2016. The timing of placements during the year will depend on a number of factors, including breeding herd decisions, producer decisions about winter wheat graze-out, and the availability of forage during the year.
Commercial beef production in 2016 came in at 6% above that of 2015. Weights were higher in the first half but fell below year-earlier as producers became more current with their marketings. Slaughter in 2017 is forecast higher as cattle placed in the later part of 2016 and first half of 2017 are marketed. Producers are expected to remain relatively current in their marketings during the year, which will limit increases in carcass weights. Beef production for 2017 is forecast at 3% above previous-year levels.
Fed cattle prices are expected to remain under pressure in 2017. Packers’ margins are seasonally weak, which is will likely impact their willingness to bid up cattle prices over the next weeks. As increased supplies of fed cattle are marketed in the spring quarter, fed steer prices are likely to remain under pressure, averaging $106-$110 per cwt during the quarter. Large supplies of fed cattle will likely continue to pressure prices during the second half of the year. Fed steer prices are forecast to average $109-$116 per cwt for the year, down from $120.86 in 2016.
U.S. Beef Exports to Remain Strong in 2017
December trade data, along with annual totals, were released earlier this month. Total beef exports for December reached 254 million pounds, 30% higher year over year. Following weak 2015 beef exports, sales to a number of Asian trading partners (Japan, South Korea, and Taiwan) helped U.S. beef exports recover to 2.55 billion pounds in 2016. Preliminary data suggests higher near-term exports, and with expected higher U.S. beef supplies and more competitive prices, robust demand will likely support an export expansion during 2017 to 2.72 billion pounds.
U.S. beef imports for 2017 are projected to continue their decline from 2016 levels to 2.74 billion pounds in 2017, due to an expected increase in domestic supplies and expected tighter supplies from Oceania.
Live Cattle Imports Forecast Lower in 2017
Total U.S. cattle imports for 2016 were reported at 1.71 million head, down nearly 14% year over year. Since 2014 highs, cattle imports from Canada and Mexico are projected to decrease for a third straight year in 2017 to 1.68 million head. During 2016, higher U.S. cattle supplies and a decline in feeder cattle prices contributed to the decline in imports of feeder animals from both Canada and Mexico. Mexico continues to finish more animals in feedlots and sell increasing amounts of beef to the United States and the rest of the world.
For cattle exports, 2016 totals were down 4% from 2015 to 69,411 head. However, December 2016 exports followed November’s record of the highest monthly total of live cattle exports since 2013. Exports for 2017 are expected to increase to 85,000 head.
Link to complete USDA report: LIVESTOCK, DAIRY, & POULTRY OUTLOOK
Feb 13 (Drovers Cattle Network) US — Profit Tracker: Healthy Profits Continue
Cattle feeding margins increased $15 per head for the week ended Feb. 10, maintaining their perch above $245 per head. That’s $420 better than at this same time last year when red ink flowed to the tune of $176 per head. Packer margins declined $13 per head, leaving their margins positive at slightly more than $5 per head. READ MORE
11.21.2025
Sausage casings bulletin, November 21, 2025
11.14.2025
Sausage casings bulletin, November 14, 2025
11.07.2025
Sausage casings bulletin, November 7, 2025