11.21.2025
Sausage casings bulletin, November 21, 2025

...
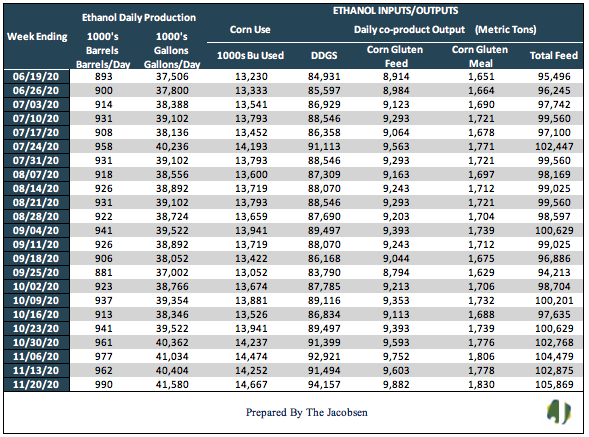
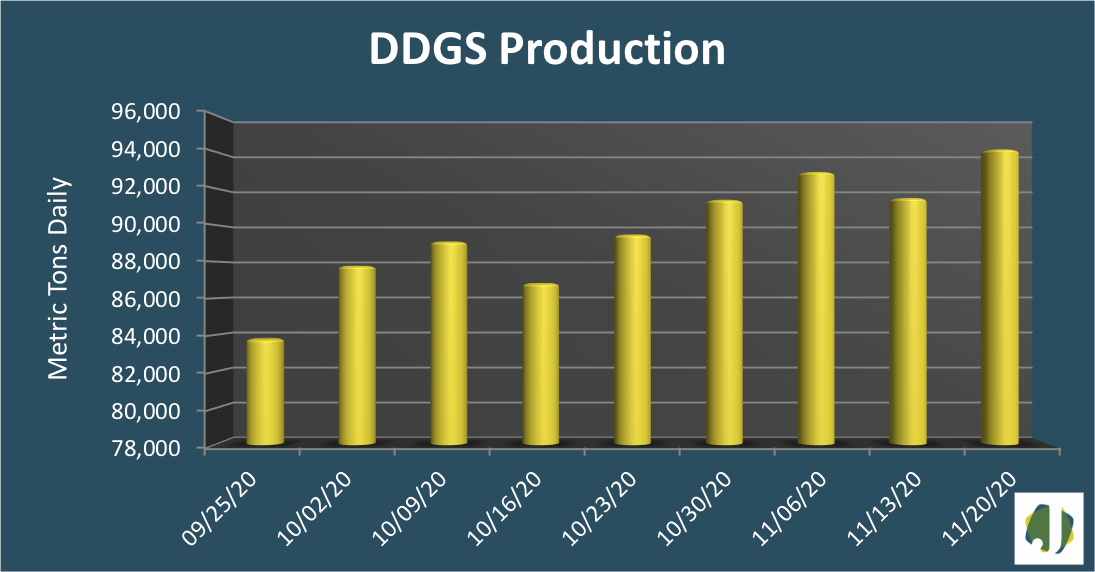
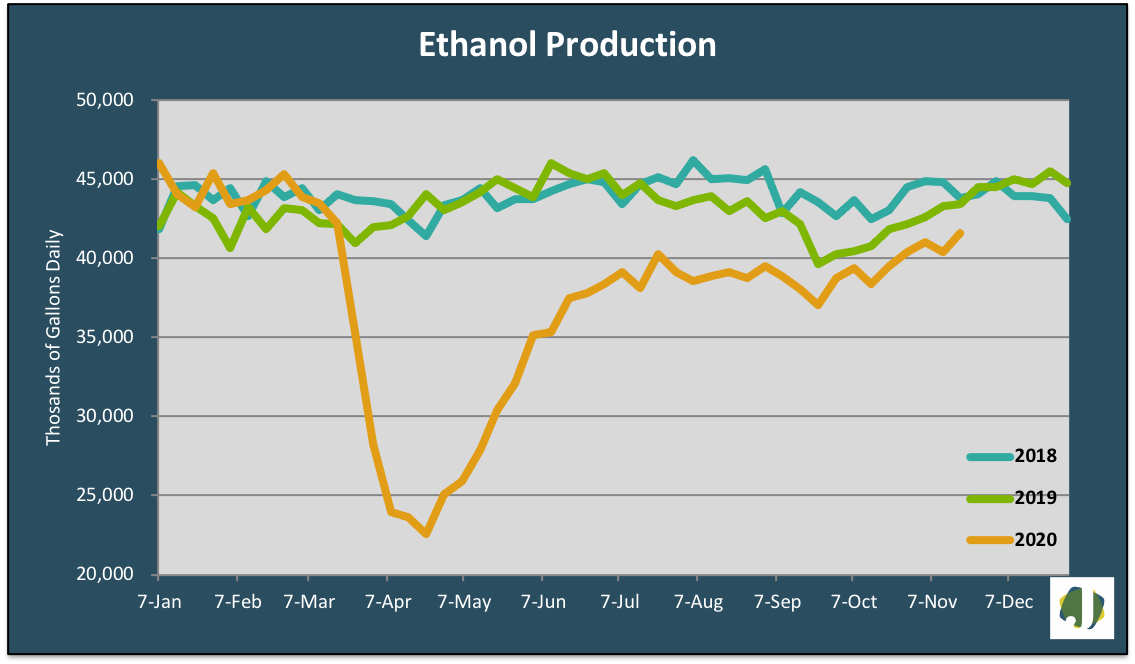
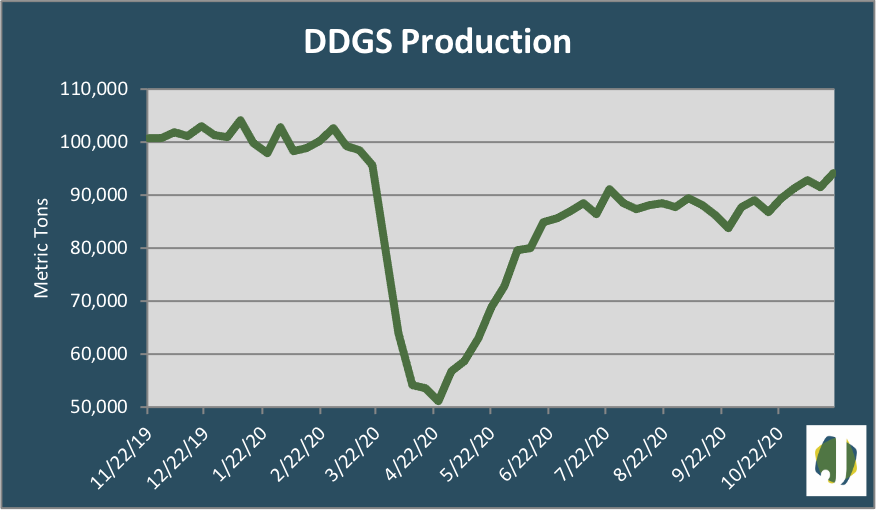
Ethanol production increased 28,000 barrels per day to a 990 million-barrel-per-day average during the week ending November 20, 2020. Ethanol and DDGS volumes hit a fresh post-pandemic high for output with ethanol production 2.9 percent over last week, but 6.5 percent below levels seen at this time last year. DDGS output increased by 2,663 metric tons per day but was 6,562 MT below daily production from a year ago.
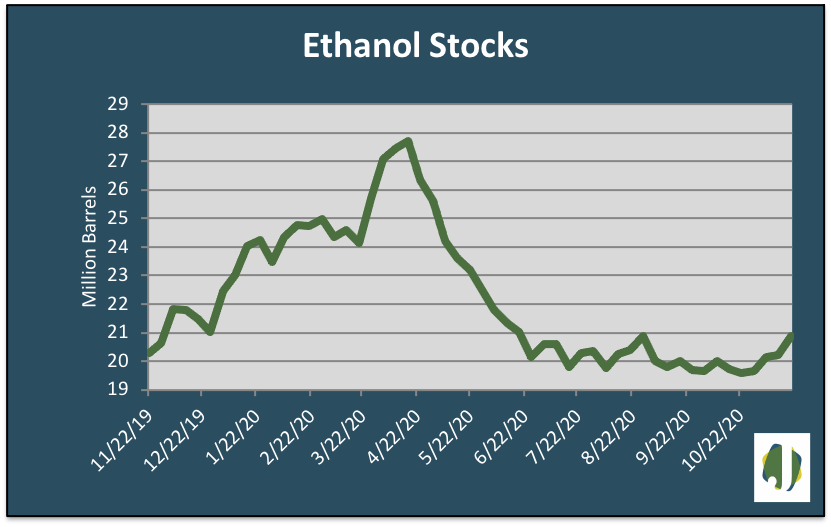
Gasoline supply declined 1.6 percent and was 12 percent below 2019 levels for the same period. Ethanol stocks continued to rise, climbing 3.3 percent to 20.9 million barrels, a 12-week high. For a second consecutive week, there were no Imports of sugarcane ethanol on the West Coast. The rise in ethanol output increased corn demand 415 thousand bushels per day. DDGS output moved with ethanol production, climbing 2.9 percent for the week.
Ethanol output is averaging 901,854 b/d per week during 2020, up 1,875 barrels daily from last week but 126,684 barrels below 2019 average weekly production. The ethanol blend rate increased to 12.16 percent. Average year to date gasoline demand is 50.1 million gallons per day below 2019 average demand.
Approximately 14.7 million bushels of corn were consumed daily in the production of ethanol and, as a co-product of production, 105,503 metric tons of livestock feed was produced daily. DDGS production accounted for 94,157 metric tons, with the balance comprised of 9,699 MT of corn gluten feed and 1,647 MT of corn gluten meal.
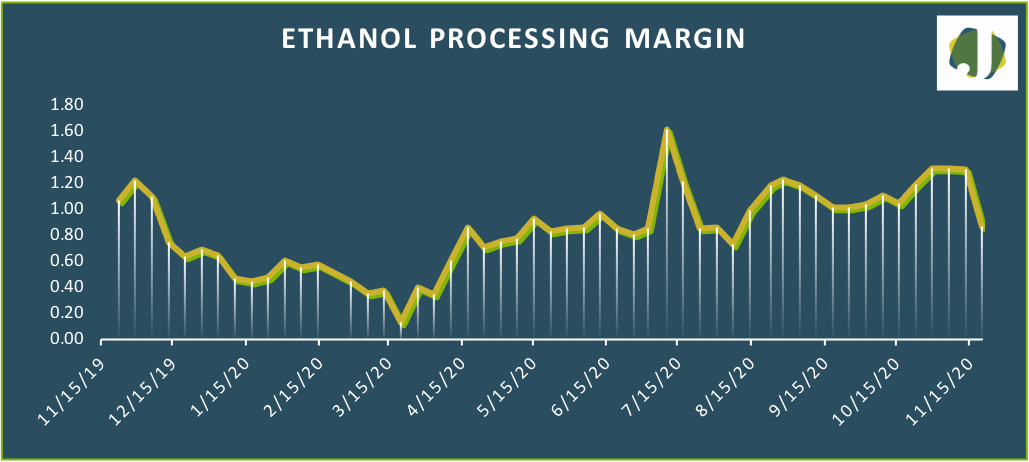
The estimated ethanol-processing margin tumbled on rising corn cost and falling ethanol prices. Revenue from ethanol and DDGS sales declined from $5.95 to $5.64 per bushel while the cost of corn climbed 13 cents to $4.06 per bushel. This allowed the margin to fall 44 cents to $0.86 per bushel. The estimated margin is 19 percent below the values seen a year ago.
11.21.2025
Sausage casings bulletin, November 21, 2025
11.14.2025
Sausage casings bulletin, November 14, 2025
11.07.2025
Sausage casings bulletin, November 7, 2025